
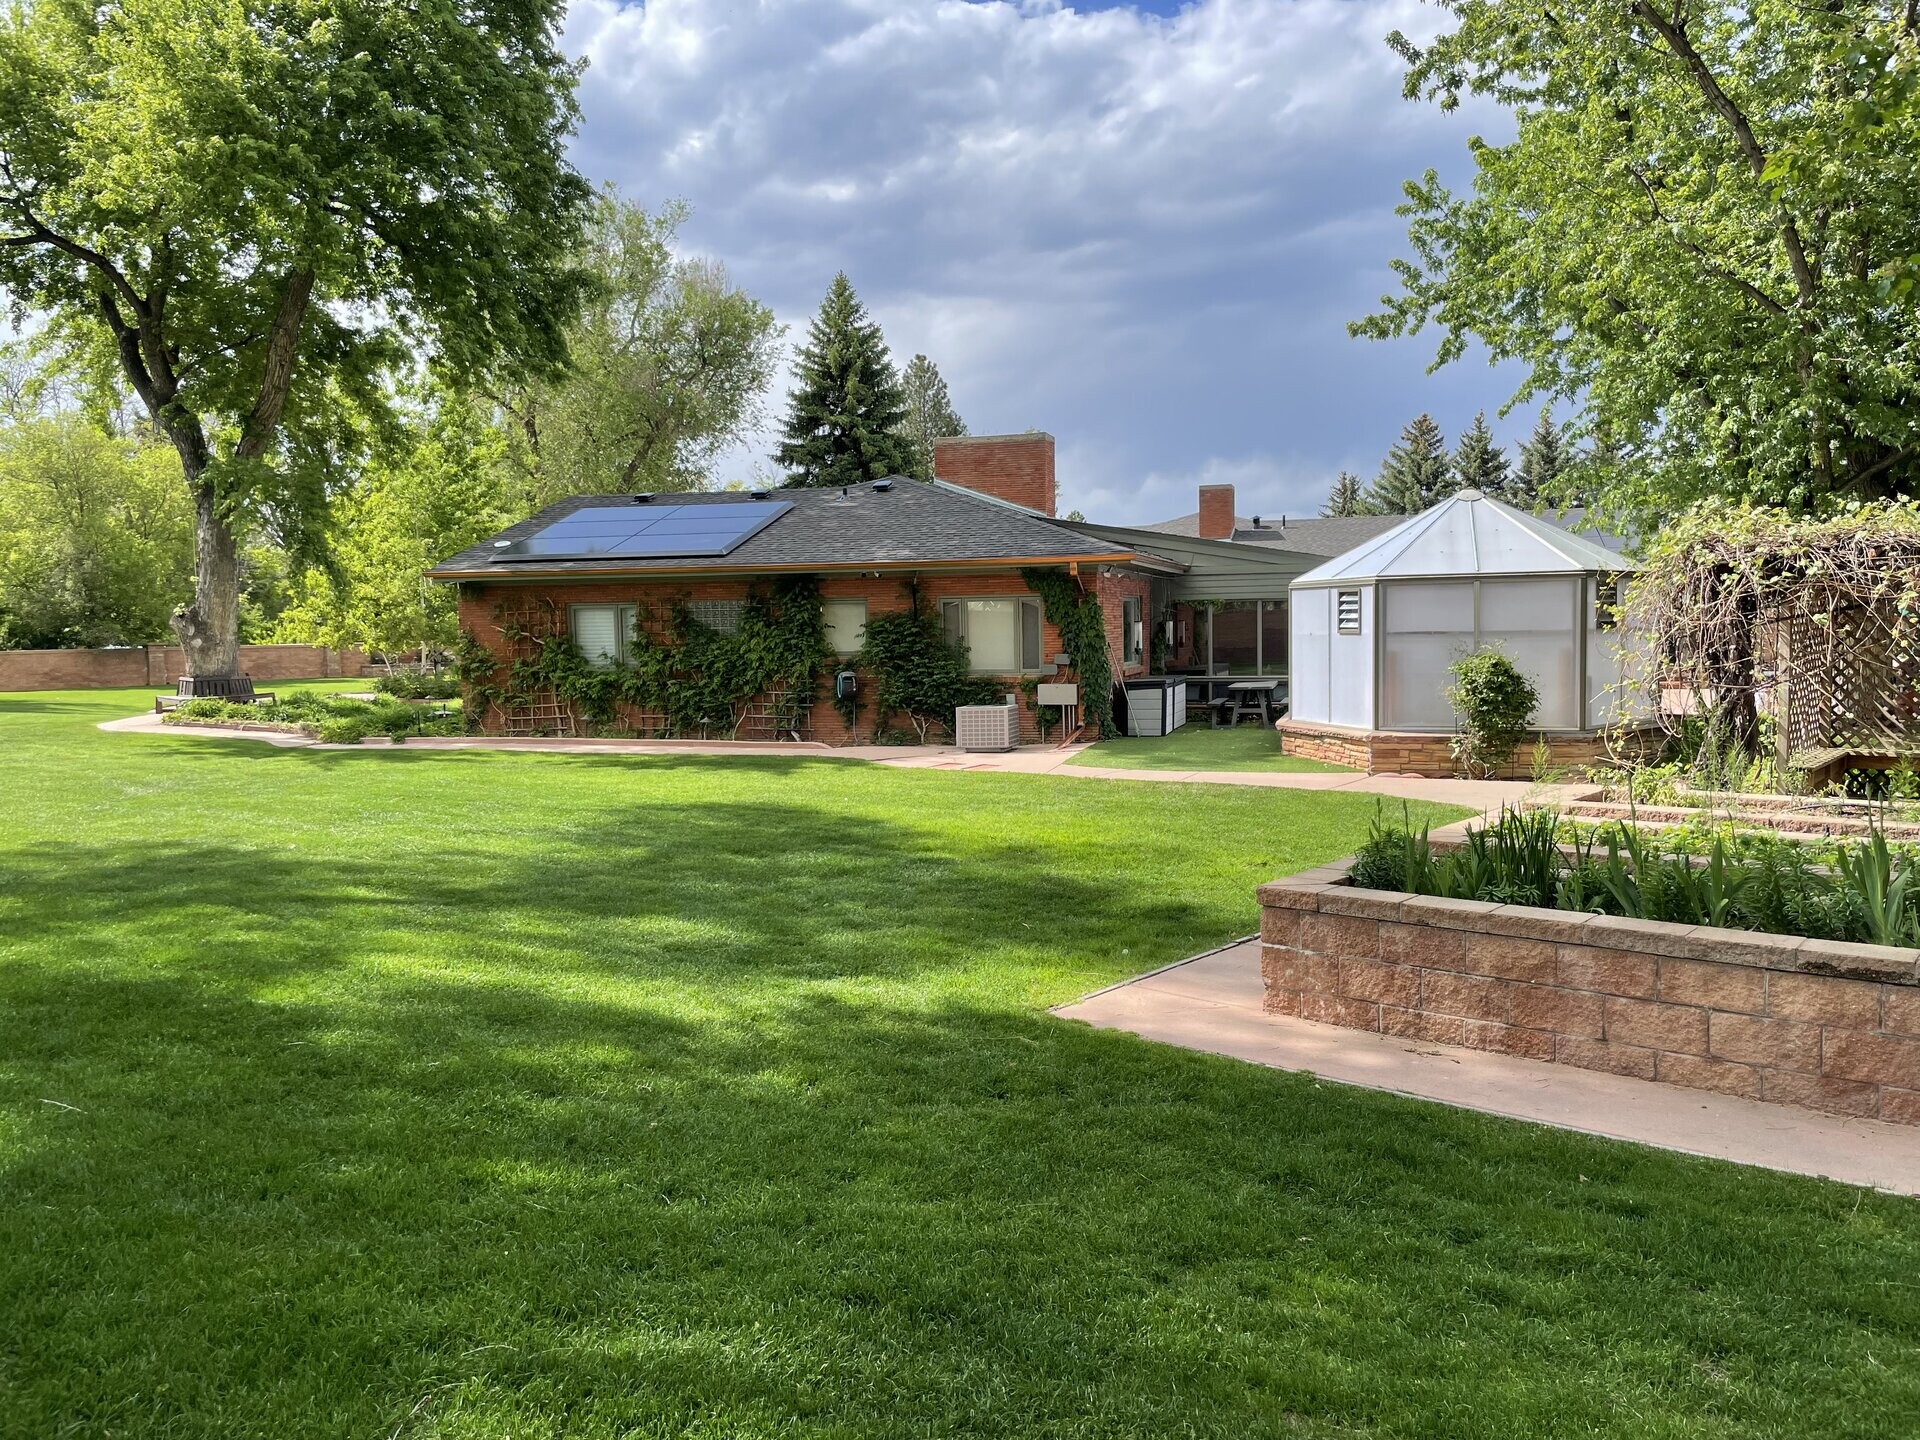
The Verdify lab is the public proof point: a real greenhouse in Longmont, Colorado where AI planning, edge control, telemetry, and operations all have to work under physical constraints.
This site publishes the proof: plans, telemetry, failures, costs, lessons, and scorecards so readers can check whether the system works instead of taking the claim on trust.

Right Now
The panels below are live Grafana trends from the public read-only telemetry path. They show 72 hours of observed greenhouse climate plus the forecast window the AI planning agent is planning against.
Temperature loop
Greenhouse temperature against the active control band. The green band is the firmware target envelope stitched from recent controller setpoints into the forecast window. Read the graph as a control trace: greenhouse temperature, outdoor pressure, forecast pressure, relay state, and solar load all in one place.
Moisture loop
Vapor pressure deficit shows plant drying pressure. VPD is how hard the air is pulling water from leaves. High VPD is dry-air stress; low VPD means the greenhouse is too humid for healthy transpiration. The panel pairs the greenhouse trace with forecast and outdoor context so the moisture posture is visible before relays fire.
Lighting loop
Solar lux, grow-light threshold, and confirmed light state. The yellow area is observed and forecast solar context. The green band is the active grow-light threshold window, and the blue state blocks show when the main grow-light circuit is actually on.
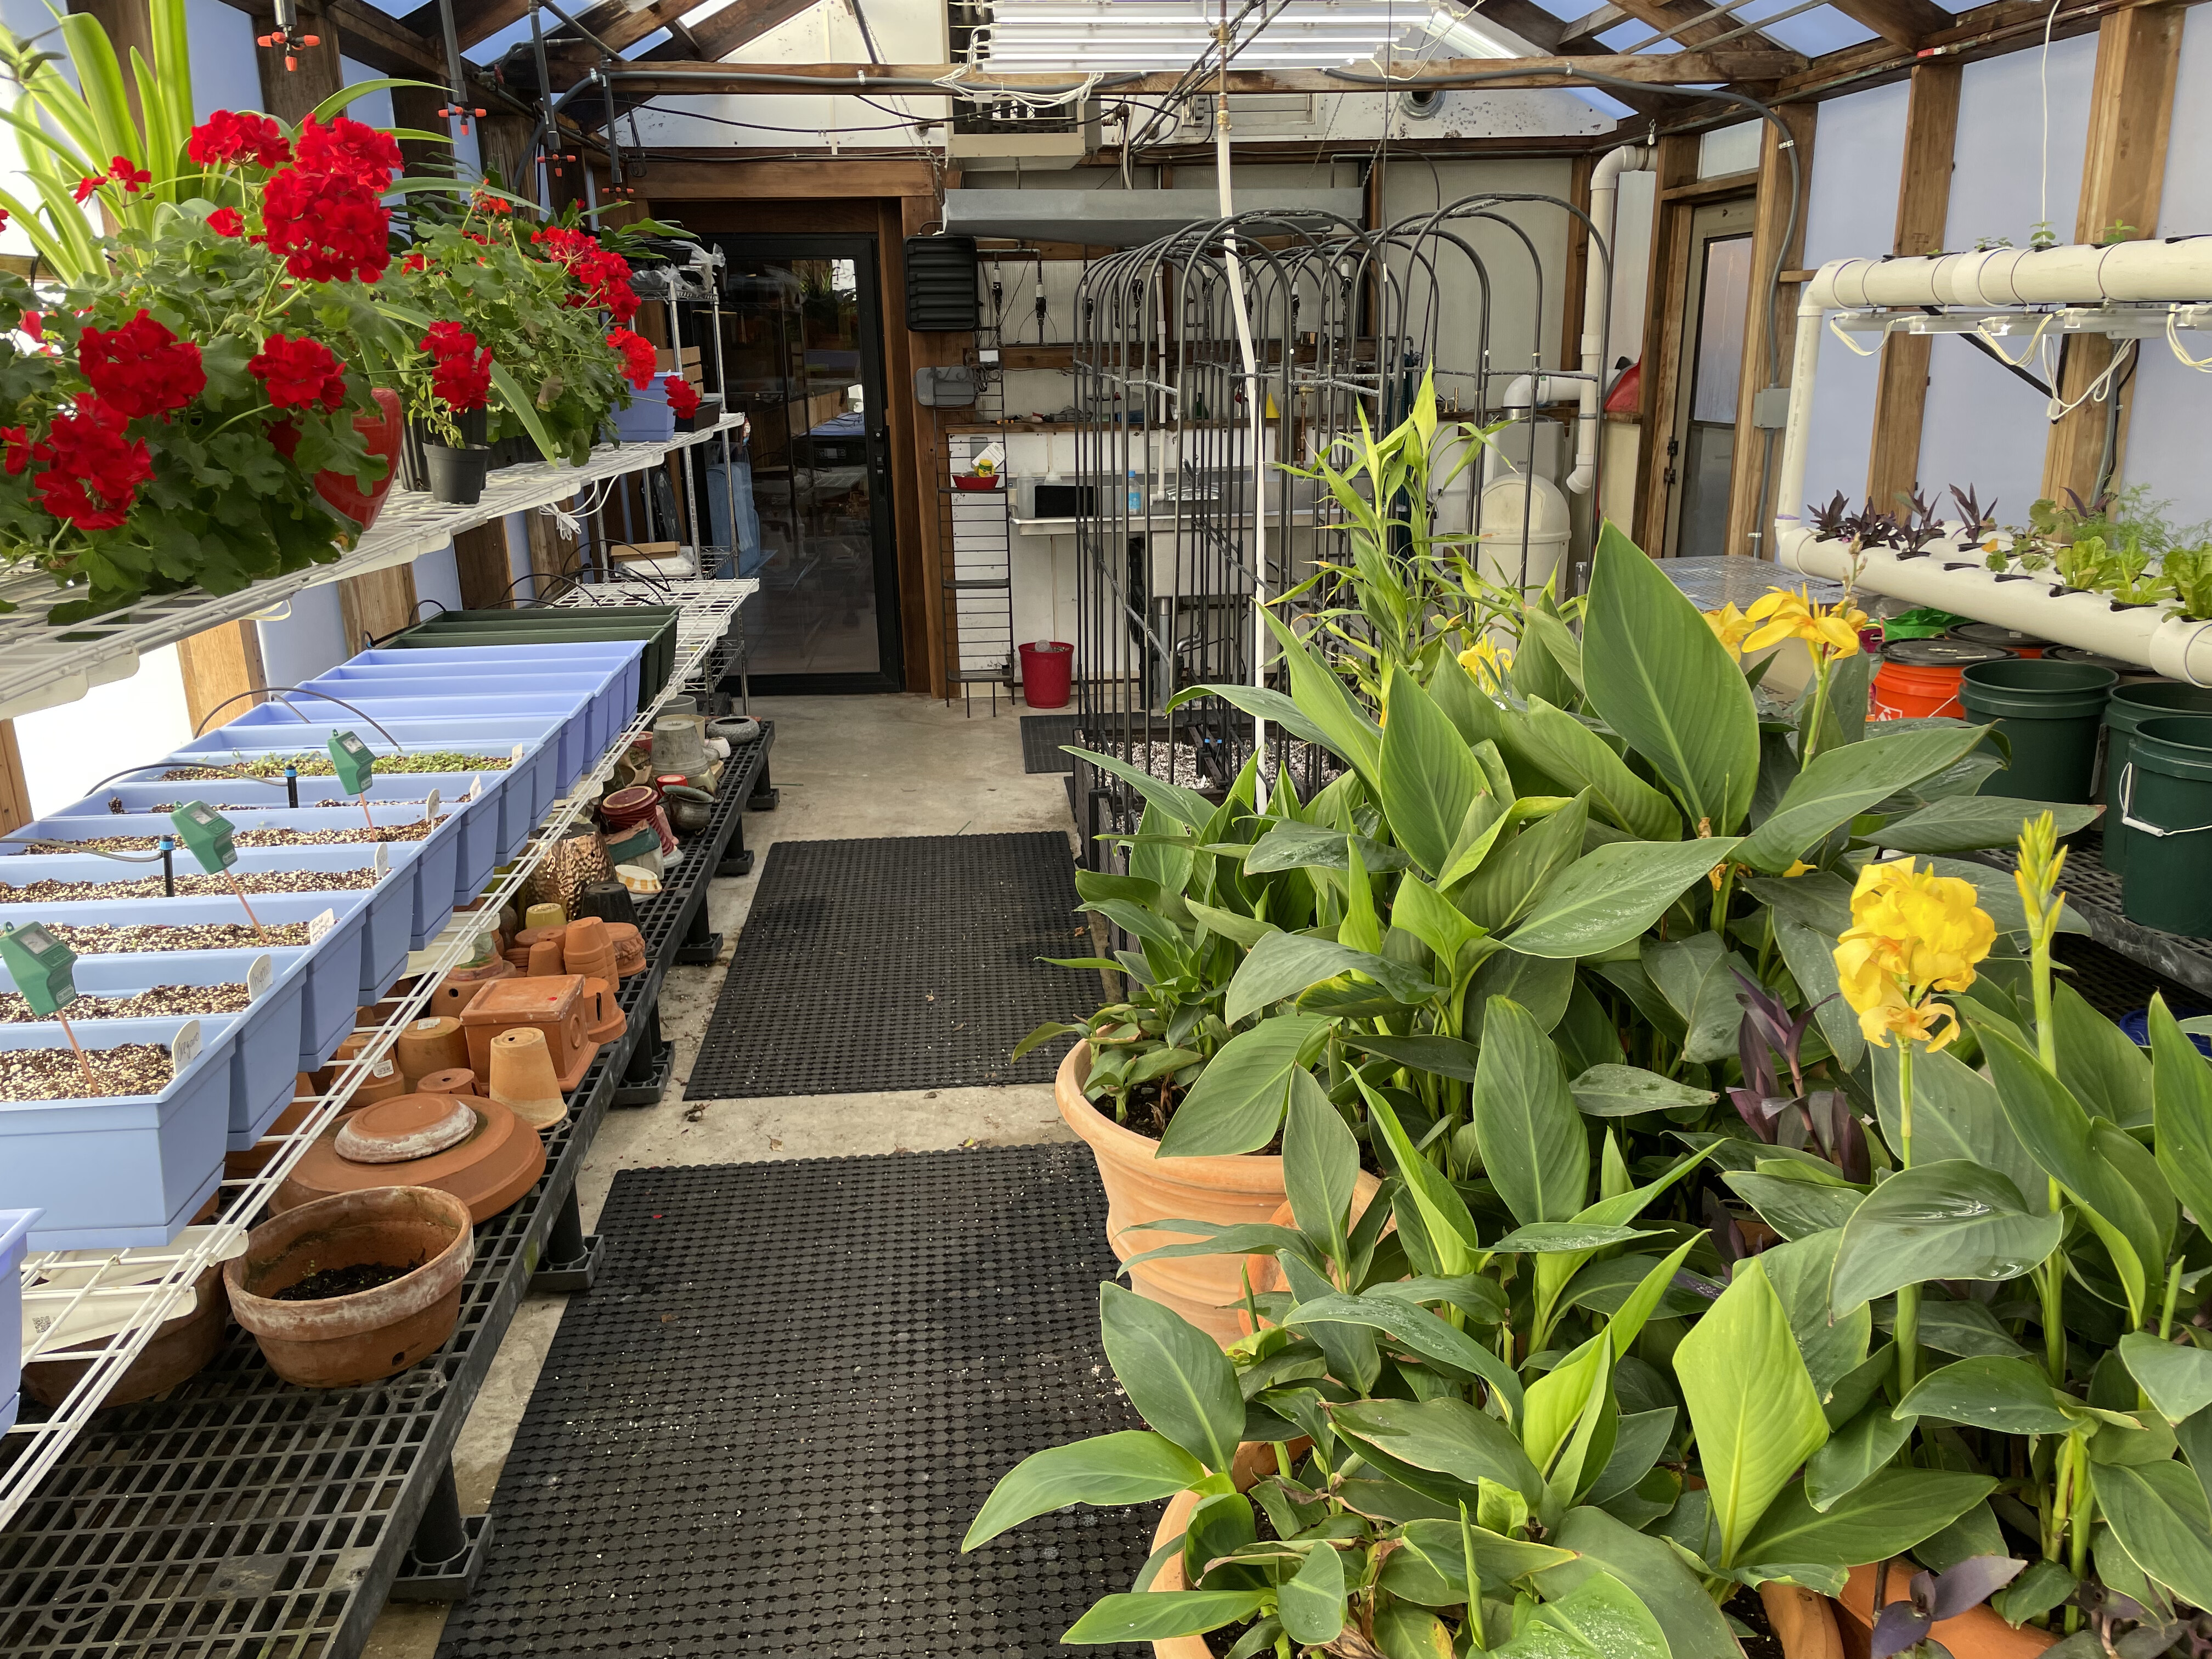
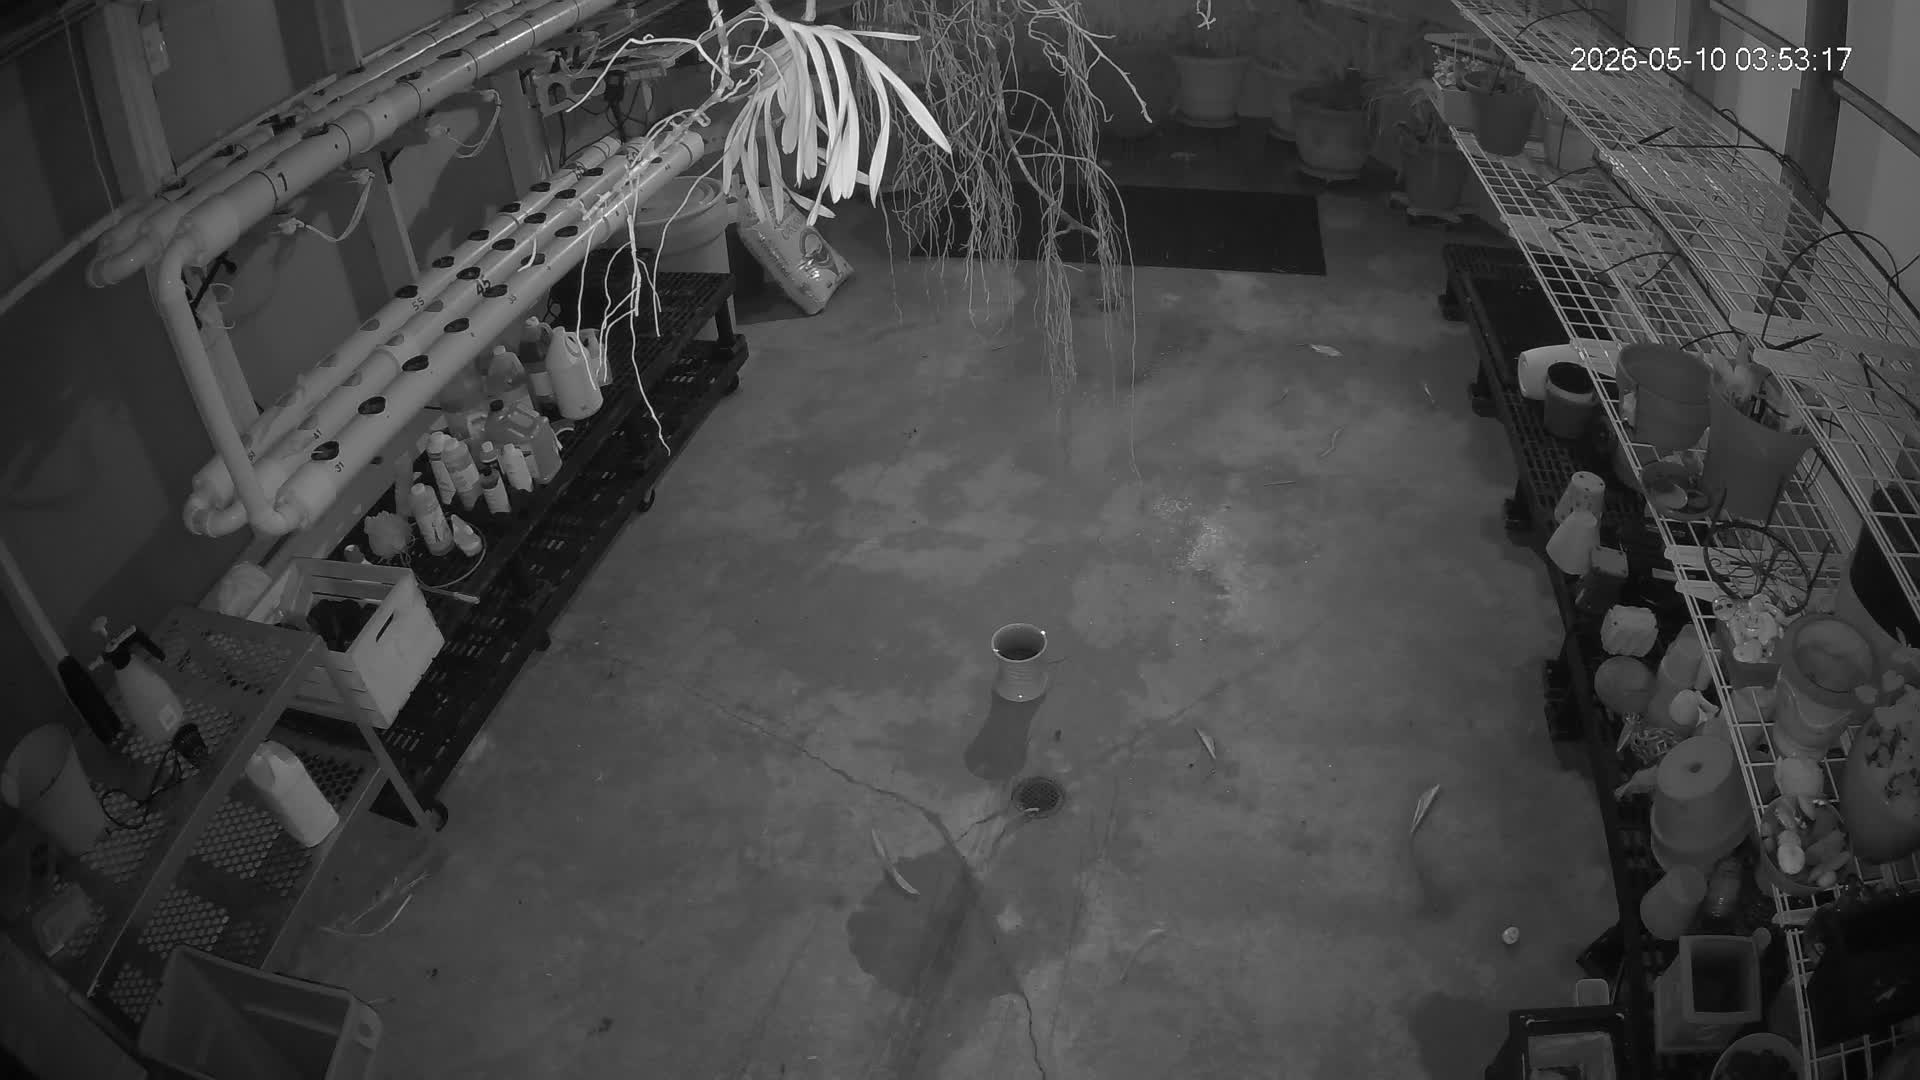
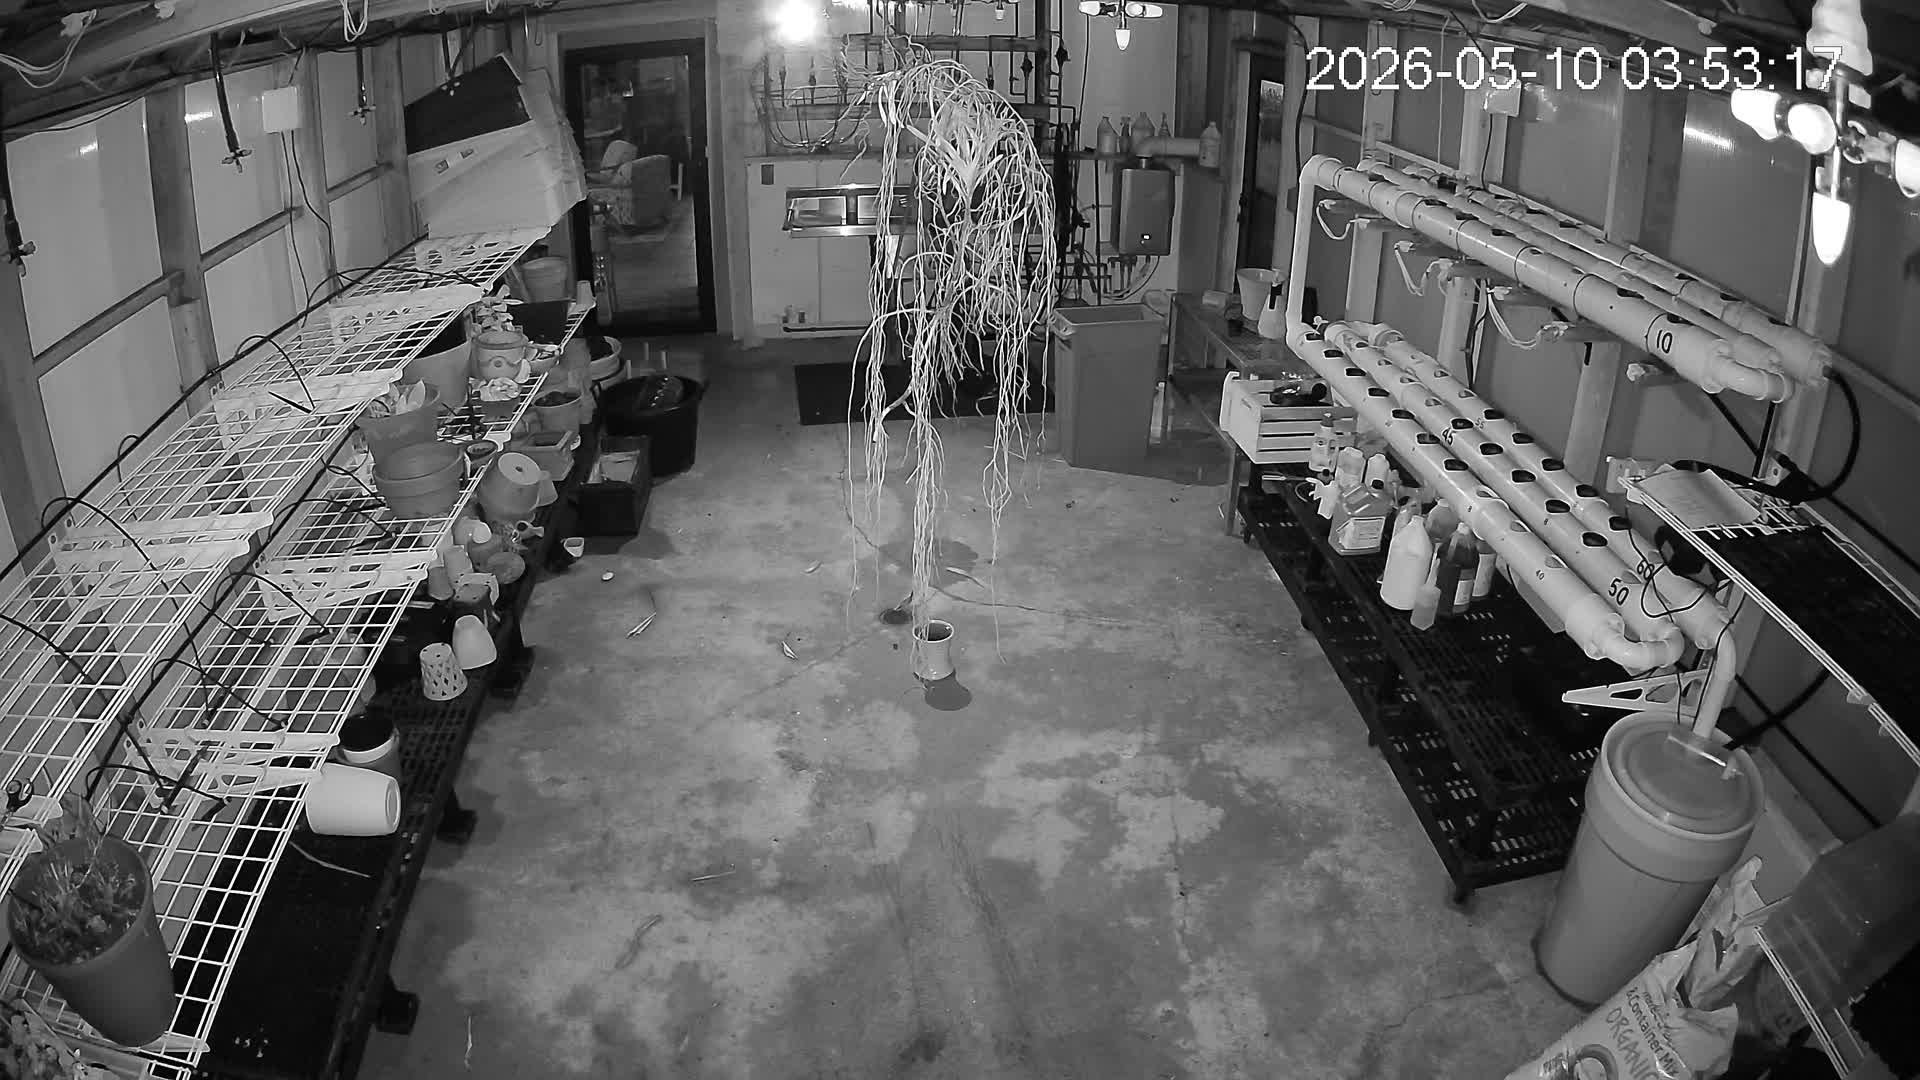
Live Greenhouse Cameras
Live public snapshots show the greenhouse behind the telemetry: crop benches, hydroponic channels, service hardware, lighting, and day/night state.
What To Look At First
The polished case study: AI may plan, but authority must be bounded, validated, measured, and operated.
The April 22-25 planner-offline window is compared with the following planner-online window.
The canonical safety page owns the relay-boundary explanation.
Start there for the live pages, generated archives, APIs, and sample exports.
Why This Is Worth Checking
This is a high-elevation Boulder County greenhouse: cold nights, intense sun, dry spring air, summer heat, winter snow, and fast shoulder-season swings.
AI Greenhouse Control explains what the AI planning agent reads before it writes a plan.
Evidence pages are the routing layer for live state, scorecards, archives, and sample data.
Operations turns plans, deviations, reminders, and operator tasks into human-readable messages without making Slack a safety layer.
Resource Use separates solar timing, electricity, gas, and water so the environmental story does not hide the remaining utility bill.
Claim Boundary
The proof layer is climate, stress, cost, water, failures, lessons, and plan outcomes.
Those need more harvest records, crop-stage normalization, and comparable baselines before they belong here.
Further Reading
- What physical constraints shape the control problem? Climate Control and Resource Use.
- How are firmware changes guarded? Firmware Change Protocol.
- What can the AI set? AI Tunables Traceability.
- How is the planner bounded? Planning Loop.
- What is the exact planner runtime contract? Planner Contract and AI Tunables.
- Can I inspect the code? Verdify on GitHub.
- Can I rebuild the pattern? Architecture includes the public-safe build notes.
- Want to compare notes or report a correction? Contact Verdify Team.